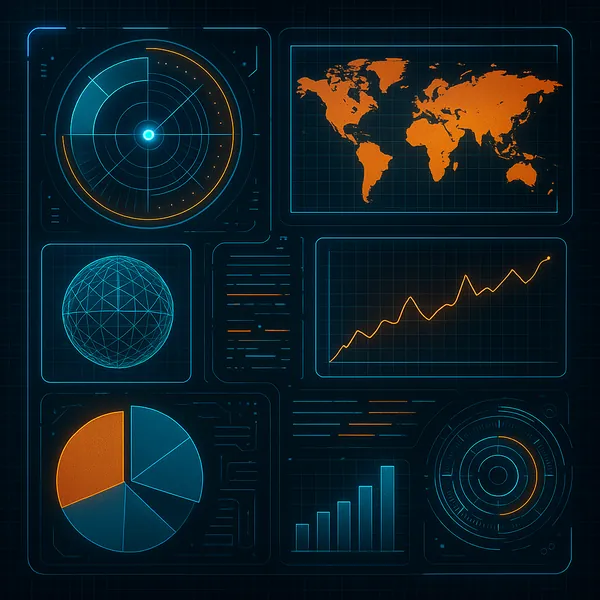
This image showcases a holographic display interface with a sleek, futuristic design. The composition features a variety of data visualizations, including a world map, radar, and multiple graphs. The color scheme is dominated by contrasting shades of orange and blue, creating a striking visual impact. The layout is organized into distinct sections, each displaying different types of information, such as a pie chart, a bar graph, and a line graph. The interface has a high-tech, digital feel, enhanced by the grid background and glowing elements. This visualization suggests a sophisticated system for monitoring and analyzing complex data.